Creating an editable and draggable polygon in Google Maps can be achieved after a bit of tweaking. The internet is flooded with multiple tutorials and articles on how to do that. Even Google’s own documentation is good enough for the purpose. However, the problem begins when you want to save the coordinates set after modifying the shape. It’s a bit difficult because of the way each of the polygon coordinates produces latitude and longitude.
Here in this demo, I’ll show you how to create truly editable, draggable polygons. You’ll also get the full coordinates set of the changed shape as well.
Demo code
Here’s my app boot file, App.vue:
<template>
  <div id="app">
    <PolygonEditable />
  </div>
</template>

<script>
import PolygonEditable from "./components/PolygonEditable";

export default {
  name: "App",
  components: {
    PolygonEditable,
  },
};
</script>

<style>
#app {
  font-family: "Avenir", Helvetica, Arial, sans-serif;
  -webkit-font-smoothing: antialiased;
  -moz-osx-font-smoothing: grayscale;
}
</style>
Code language: HTML, XML (xml)
In the above file, I’ve only imported a component PolygonEditable and used it directly inside the app container.
Here’s the content of the PolygonEditable.vue file:
<template>
  <div>
    <div class="header-margins">Google Maps Polygon Editable</div>
    <div class="np-credits">www.nightprogrammer.com</div>
    <div id="polygon-label-map" class="map-margins"></div>
  </div>
</template>

<script>
import loadGoogleMapsApi from "load-google-maps-api";
import { gMapsApiKey } from "./../constants";

export default {
  name: "PolygonEditable",
  data() {
    return {
      map: null,
      polygonCoords: [
        { lat: 18.539420292094686, lng: -84.672421875 },
        { lat: 18.4193463830188, lng: -78.64716406249998 },
        { lat: 24.93083548704131, lng: -79.54566796875 },
        { lat: 18.600174829995048, lng: -71.074021484375 },
        { lat: 18.466000000000005, lng: -65.151203125 },
        { lat: 25.51439129975102, lng: -65.525390625 },
        { lat: 32.02341998455439, lng: -66.69059375000002 },
        { lat: 32.14777939665489, lng: -74.39127734375002 },
        { lat: 27.991369164115433, lng: -72.44083789062503 },
        { lat: 24.150437866197347, lng: -71.19352343750003 },
        { lat: 31.925011730662227, lng: -80.61832812500002 },
        { lat: 32.12471864861541, lng: -86.54801562500002 },
        { lat: 26.56281060965864, lng: -85.28765625 },
        { lat: 22.24397398338144, lng: -84.7603125 },
      ],
      polygonShape: null,
    };
  },
  methods: {
    loadDrawingTools() {
      const { google } = window;
      const myDrawingManager = new google.maps.drawing.DrawingManager({
        drawingMode: null,
        drawingControl: true,
        drawingControlOptions: {
          position: google.maps.ControlPosition.TOP_LEFT,
          drawingModes: [google.maps.drawing.OverlayType.POLYGON],
        },
        polygonOptions: {
          draggable: true,
          editable: true,
          fillColor: "#cccccc",
          fillOpacity: 0.5,
          strokeColor: "#000000",
        },
      });
      myDrawingManager.setMap(this.map);
    },
    updatePolygonCoordsState() {
      const allPolygonCoords = this.polygonShape.getPath();
      const coordsToSet = [];

      for (let i = 0; i < allPolygonCoords.length; i++) {
        const data = {
          lat: allPolygonCoords.getAt(i).lat(),
          lng: allPolygonCoords.getAt(i).lng(),
        };
        data && coordsToSet.push(data);
      }
      this.polygonCoords = coordsToSet;
      console.log(this.polygonCoords);
    },
  },
  mounted() {
    loadGoogleMapsApi({
      key: gMapsApiKey,
      libraries: ["places", "drawing", "geometry"],
    }).then(async () => {
      const mapZoom = 12;
      const { google } = window;
      const mapOptions = {
        zoom: mapZoom,
        mapTypeId: google.maps.MapTypeId.HYBRID,
        center: new google.maps.LatLng({ lat: 23, lng: 57 }),
        mapTypeControl: true,
        streetViewControl: false,
        mapTypeControlOptions: {
          position: google.maps.ControlPosition.BOTTOM_LEFT,
        },
      };
      this.map = new google.maps.Map(
        document.getElementById("polygon-label-map"),
        mapOptions
      );

      const tempBounds = new google.maps.LatLngBounds();

      for (let j = 0; j < this.polygonCoords.length; j++) {
        const x = {
          lat: this.polygonCoords[j].lat,
          lng: this.polygonCoords[j].lng,
        };
        const BoundLatLng = new google.maps.LatLng({
          lat: parseFloat(x.lat),
          lng: parseFloat(x.lng),
        });
        tempBounds.extend(BoundLatLng);
      }
      const centroid = tempBounds.getCenter();

      this.polygonShape = new google.maps.Polygon({
        paths: this.polygonCoords,
        strokeColor: "#ffffff",
        map: this.map,
        strokeWeight: 3,
        fillColor: "#7b00ff",
        fillOpacity: 0.6,
        zIndex: 99999,
        editable: true,
        draggable: true,
      });

      this.polygonShape.setMap(this.map);
      this.map.setCenter(centroid);
      this.map.setZoom(4);
      //this.loadDrawingTools();

      this.polygonShape.getPaths().forEach((path, index) => {
        google.maps.event.addListener(path, "insert_at", () => {
          this.updatePolygonCoordsState();
        });

        google.maps.event.addListener(path, "remove_at", () => {
          this.updatePolygonCoordsState();
        });

        google.maps.event.addListener(path, "set_at", () => {
          this.updatePolygonCoordsState();
        });
      });
    });
  },
};
</script>

<style scoped>
.header-margins {
  margin-left: 30px;
  margin-top: 20px;
}
.map-margins {
  height: 300px;
  width: 500px;
  margin: 20px 30px;
}
.np-credits {
  margin-left: 30px;
  margin-top: 4px;
  font-size: 12px;
}
</style>
Code language: HTML, XML (xml)
Explanation
Let me brief the code above a bit:
On line 5, I’ve only used an HTML id to target the Google Maps component to mount at. I’ve used a local state called map (I’ll be referring to it as this.map) to hold the instance of the Google Maps data.
Then on line 18, I’ve defined a local state polyCoords which I’m using to hold a list of coordinates. You might note that I have 14 coordinates right now.
On line 34, I’m using a local state polygonShape to hold the Google Maps Polygon data.
I’ve used a method named loadDrawingTools() on line 38. I could use this method to load the basic drawing tools required for drawing polygons on the map. In this demo, I won’t be using it as I already have my coordinates defined in the polyCoords local state.
Coming to line 57, I’m using a local method called updatePolygonsCoordsState(). I’ll call this method whenever I need to update the coordinates data stored in the polyCoords local state. Note that, I’d need to call this method whenever there’s a change in the polygon shape.
Through line 96 to 106, I’ve iterated over the polygon coordinates and used Google Map’s latLngBounds() to expand the bound of the visible map.
I’ve created a polygon using new google.maps.Polygon() and assigned it to this.polygonShape local state. You’d notice that I’ve used this.polyCoords as paths. I’ve also set the editable and draggable values to true. Finally, I’ve bind the polygon to the map on line 121.
On line 126, I’ve iterated over each of the polygon path (pair of coordinates). I’ve also added three event listeners to the path named “insert_at“, “remove_at“, and “set_at“. Each of these will call the updatePolygonsCoordsState() method. The called method will then update the coordinates in the original state accordingly.
Example
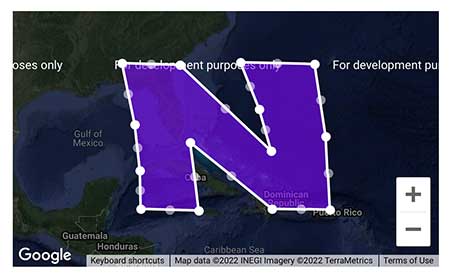
Let’s have a look how that works. This is the map view you’ll get with the 14 coordinates set:

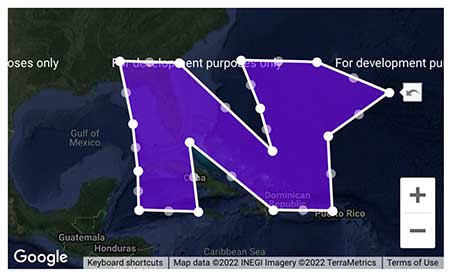
Now, if I hold and drag any of the middle points, it’s going to create a new node. The new node will again have two sibling nodes on its left and right side respectively:

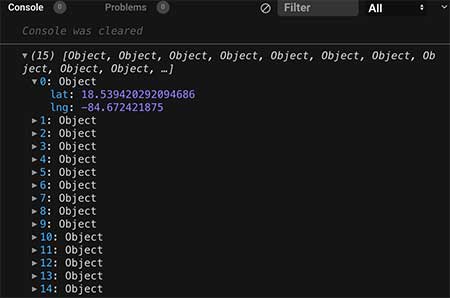
I’ve used a console.log on line 69, to show the total number of coordinates at every shape change. You’ll notice that it’ll now show 15 coordinates in total. The sibling nodes won’t be included. These sibling nodes ain’t really activated unless you drag and change their position.

You can find a working version of the above code from my repos below:

Works like charm! been looking for this for a long time! Thanks for the great explanation
Thanks